TThe standard version of Senspods, Zaopods and Pods4Fun embeds a Bluetooth module. Why use Bluetooth?
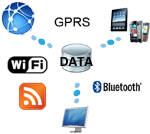
In this standard version, data is sent via Bluetooth to a mobile phone or a tablet. The mobile device can read data and send it using its own radio modules (WiFi or 2G/3G/4G). This decreases costs of the sensor network by avoiding the purchase of an additional gateway. It also allows the use of a program (an application) to directly understand the data gathered.
For applications requiring to continuously send data in real time, a gateway can be used. This gateway collects data from sensors before sending them via Ethernet connectivity, WiFi (if a network is available) or 2G/3G (data SIM card required).
There are two ways of managing data. It can be either be stored locally or sent to a remote server or to the Cloud.
Data can be stored directly on a memory card embedded in the sensor (standard 2Go SD Card), on the phone as a CSV file or after having been acquired it can be streamed from the memory card/phone to a server (store and forward configuration).
Data can be sent via different solutions (see previous chapter). If using a phone, the application can also transfer data via RSS. They can be sent to a distant server, either ours to use the web interface (Sensdots) or to your own server. From Sensdots, historical data sent can also be downloaded in a CSV format.
The phone application can be used to display real time data. It also gives an interpretation with respect to “typical values (e.g; radiation, particles, NOx, Ozone etc…).
From Sensdots (the web interface) data can be geolocated on a Google map and read in real time. A historical graph allows to compare data and they can be downloaded from there.