July 20, 2012

Using Senspods, it is now easier than ever to check indoor environmental quality.
The new Senspods were developed and trialed through a grant from the Eco Energies Innov funding program Eco Innov focusing on home energy savings.
Studies at Coventry University clearly showed that monitoring CO2, temperature, humidity and amount of light is also useful for home energy profiling and to better understand where gains can be made towards passive homes.( Coventry Passive Homes ).
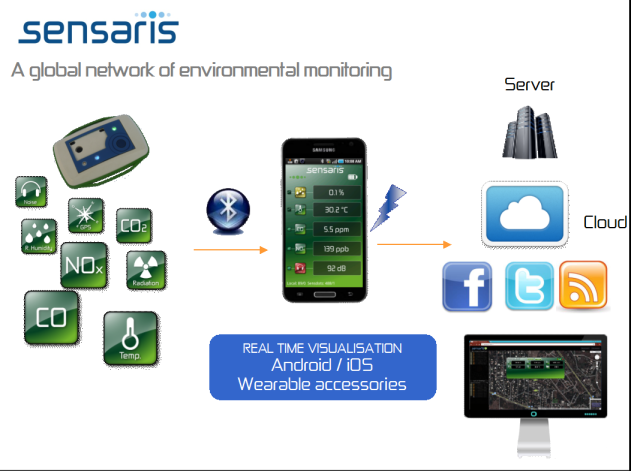
The data can be visualized in real time using mobile phones or data sent to the cloud can be to compare the environmental quality of different homes.
Public building requirements: New focus on schools and day care centers in France.
In France , a new requirement for day care centers came into effect on July 1 st 2012 and requires all buildings to characterize VOCs (formaldehyde and benzene) and CO2. Carbon dioxide has no effect on health but it is an excellent indicator of the degree of air confinement and renewal rate.
A recent study in the Midi Pyrenees regions shows that out of 310 schools, 21 % have insufficient ventilation.Midi Pyrennees Schools
This in line with a previous study which looked at 160 schools in 13 regions in France which found that 16 % of schools (25 % in elementary schools) did not meet the French Committee for public health values. Indoor Air quality study
If you want to find out about your own living spaces, your office, gym or if you’d like to know how schools can improve the well being of the students, we probably have a solution for you.

June 22, 2012

To answer the request from developers wanting to integrate Senspod data into their own applications, we are releasing our first version of the Sens2Cloud API. The principles that guided us were ease of use, flexibility to adapt to new types of sensors, and flexible controls.
Dominique Guinard (with Ion and Mayer) highlighted the advantages of using REST for wireless sensor networks in this publication:

He concludes “Participants identi ed that RESTful Web services represent the most straightforward and simple way of achieving a global network of smart things because RESTful Web services seamlessly integrate with the Web.”

Now that the framework is released, the next Senspods will all follow the same data format, but since we’ve got already 15 Senspods, you have a busy summer ahead of you.
In this manual, you will find how to deal with:
Authentication
Query format
Returned values

Senspod’s functions
Get the Senspod’s frame data units
Extract the last X Senspod’s frames
Obtain Senspod’s frames between two dates

Have fun.

Sens2Cloud manual
Sens2Cloud manual

May 4, 2012

After the success of Senspods used for the “Montre verte” and the” Copenhagen wheel” projects, we wanted to build services based on information shown in real time on wearable platforms.
We started with the Sony Ericsson Live View and Android based phones.The result is shown below:

Senspods’ data can be provided as RSS feeds, therefore very simple RSS readers can display information on wearable devices, so developers can let their imagination run wild for new applications based on sensor data.
Since we can now also stream Senspod data to iPhone, our next development will be to use the amazing Pebble Watch !!

Stay tuned and contact us if you are interested to become one of the early adopters.

March 11, 2012

Picarro (http://www.picarro.com) produces highly sensitive and accurate gas sensing instruments which rely on a technology called cavity ring down spectroscopy. The company published a fascinating methodology to determine actual CO2 emissions from a city.This was performed during the Davos summit.You can see the results of such visualisation here:
CO2 emissions over Davos

Actual methodology is detailed in this publication from Picarro:
CityCarbon_Science_and_Data

This graph compares the emissions for cities of various scales and built around different economies: Davos, Seoul and Tokyo.

Even though sensors used for participatory sensing such as Senspods are not laboratory instruments, once properly calibrated and used by citizens to cover city wide areas, there is no reason why mobile sensors could not be used to quickly build a global environmental network.

January 31, 2012

Yesterday was a very special day as we received in Munich an award for the Bluetooth Worldwide Innovation Cup in the category “Automotive, entertainment and other” .
This has a special meaning for us as it validates our vision to build a global network of environmental monitoring sensors for citizens. Mobile phones are personal devices but our environment is a shared responsibility and concern. The Senspod family is growing quickly and there will be exciting announcements in the near future so stay tuned.

We thank the Bluetooth SIG and the members of the jury for this recognition, and for those of you that could not attend the ceremony at ISPO, here is our presentation.

December 10, 2011

After beta tests in 6 countries (out of 18 countries where Senspods are used), we are now releasing Senspod App.
Starting with EcoSense, you can now download software directly from the Android Market, install it on your Android devices and start making a difference for the environment in your city.
Simple steps:

- Scan the QR code,
- select install,
- launch the app,
- select your Senspod and enter 1111 for pairing.

Send your friends the web address to see your data live. You are done.

Current record is 1:48 (and that was even without any warm-up whatsoever).Can you top that ??

November 18, 2011

We are happy to announce that Sensaris has been selected as part of the 3 finalists in the category “Automotive, Entertainment & More using Bluetooth low energy technology”.

Senspods qualification for this competition confirms our belief that Bluetooth is the leading enabling technology for Internet of Things applications.
This is definitely the right category for Senspods as we showed their use for the IBM Greenhaviour project where Senspods were mounted on a driverless car, and it fits with the entertainment part as well since we initially developed the “Montre Verte” concept and have now taken it to the next level using wearable accessories.

The pervasiveness of mobile phones with Bluetooth radios is both an advantage and a challenge.It is an advantage in terms of power consumption and low gateway costs (any mobile phone with Bluetooth will do). It is a challenge because our software platform needs to work similarly on Nokia Series 40 phones, Android phones from version 1.6 to 2.3 or iOS devices.
Our recent demo in Mumbai definitely showed that crowdsourcing is the way forward for improved sustainability. No matter what the outcome of the competition is, we will be increasingly focusing on wide scale applications in the coming year. Stay tuned !

Press Release

November 10, 2011

Sensaris adds radiation monitoring to its Senspod platform. Recently some areas with high radiation levels have been detected by citizens in Japan and it is clear that a large number of Geiger counter is necessary to keep track of safe areas over time.
The RemPod has been designed to provide such a service to citizens and municipalities as it measures alpha, beta and gamma radiation and GPS coordinates, and either stores the data on a memory card or displays the values in real time on mobile phones via Bluetooth transmission.
Users can view the data in real time on their phones and also share the data using geosocial networking tools. The integration with mapping and social networks enables rapid sharing of safe areas; people wanting to know more about the safety of their immediate area can access the web based visualization interface using any device with a web browser.
For fast deployment several devices can also be simultaneously connected to WiFi or 3G networks. Since RemPods are also designed to store measurements in a built in microSD memory card, they can record data even in conditions with no network access such as ships at sea for example. The sensors will also be valuable tools to monitor soil decontamination and to then keep track of the evolution around storage facilities.

“Safecast in Japan paved the way for citizen centric radiation monitoring but we wanted to broaden compatibility with smartphones and simplify data sharing via social networks. We are very pleased that the initial testing of RemPods by daily users in 5 countries has been successfully completed both from an accuracy and a software ease of use point of view. Senspods are our first building block of Social, local, mobile environment monitoring.” declared Michaël Setton, founder and CEO of Sensaris.

RemPod brochure

September 30, 2011

The Qatar University Wireless Innovations Centre (QUWIC) at the Qatar Science and Technology Park has unveiled two new systems that they say will deal with some of the significant logistics and systems management issues currently facing Qatari institutions.
Using its new Labeeb data processing system, QUWIC has launched Masarak, a comprehensive solution to provide real-time and historic traffic information in Qatar, and a user interface that will support services and applications using this information to address the needs of three market segments: government entities, enterprises, and consumers.
Users can access these systems through mobile device applications, web applications, voice, SMS and broadcast, and will allow users to monitor traffic congestion on an interactive map, as well as get directions between locations that factor in traffic flow, ease of use and distance. The system can monitor data from vehicles such as Mowasalat taxis and buses, and will also integrate data from cameras. QUWIC officials say that the system promises to assist with traffic congestion and monitoring, vehicle tracking, trip planning, dispatching and intelligent fleet management.

Users will be able to monitor air quality in real time on their mobile device According to QUWIC officials, strategic partnerships have been formed to create comprehensive business ‘eco-system’, including the Ministry of Municipality and Urban Planning, the Ministry of Interior and Traffic Department, Mowasalat, Qtel, Qatar University, and Qatar Foundation.
QUWIC has also partnered with Qatar Foundation’s HSSE Department, the Qatar Energy and Environment Research Institute and the Ministry of Environment to design and build its Qatar Air Pollution Surveillance System (QAPSS).
The system will use the Labeeb data processing technology to integrate data from air monitoring sensors that are set to be installed along Qatar’s roads with data from larger air quality monitoring stations at Qatar University, Education City, the Ministry of Environment and other locations around Doha.
QUWIC officials said that additional sensors can be installed at construction sites, smart cities, sports facilities and educational institutions as needed.
These stations will be monitoring levels of particulate matter, oxygen, carbon monoxide, carbon dioxide, nitrogen oxide, and sulphur oxide, as well as other atmospheric conditions such as temperature and humidity, all of which have an effect on human health.
QAPSS will help build a bank of historical and real time environmental data that will provide a clear map of air quality conditions around Doha, which will allow experts to advise on possible safety measures and government policies.
Users will also be able to monitor air quality conditions in real time on their mobile device through an application designed by QUWIC’s Mobile App Development Centre. QUWIC officials said that these systems were purpose built, and will continue to evolve to meet new challenges and tackle new problems as they come up. They are in a position to be flexible and adaptive, as these solutions have been built in-house and have not been brought in from institutions outside of Qatar.

Source:

September 24, 2011

We have been working on this topic for several years and thought it would be beneficial to gather and share in one location technical information pertaining to wireless sensors for urban environmental monitoring.

Here is a map of the projects/studies we are aware of, and we will constantly update it of course. If you are aware of other projects that we should add to this list, please send us information.

View Sensaris Environmental monitoring sensor network research in a larger map

Korea Seoul micro sensor node

air pollution based on geosensor network Korea

EcoBus Serbia

Columbia CO augmented reality

India bus GPRS GPS Air sensing

Maqumon Vanderbilt

INTEL COMMON SENSE SAN FRANCISCO

common Sense novice users

Open Sense Zurich 1

Open Sense Zurich 2

Cambridge Message

VITO Noise and air quality sensor network

URBAN NETS KEAN UNIVERSITY

August 4, 2011


The urban bicycle boom in Europe seems to be a steady trend, and there seems to be more benefits than just fitness and global warming. In Toulouse, France, Oramip (http://www.oramip.org) in charge of measuring air quality in the Midi-Pyrennees region,  conducted in 2008 and 2009 a very interesting study comparing the exposure to NOx, CO and fine particles for different modes of transportation.

Personal exposure for various transportation modes.

The main results are reproduced below:

  • NO2:nitrogen dioxide

Car:83 ppb (156 µg/m3)

Bicycle:12 ppb (22 µg/m3)

Pedestrian: 20 ppb (22 µg/m3)

Metro: 13 ppb (22 µg/m3)

Bus: 33 ppb (22 µg/m3)


  • CO: carbon monoxide

Car:1.05 ppm (1.2 mg/m3)

Bicycle:0.08 ppm (0.09 mg/m3)

Pedestrian: 0.120 ppm (0.14 mg/m3)

Metro: Too low to measure (0 mg/m3)

Bus: 0.03 ppm (0.03 mg/m3)


  • PM 10: fine particles

Car: 60 µg/m3

Bicycle:38 µg/m3

Pedestrian: 43 µg/m3

Metro: 292 µg/m3

Bus: 75 µg/m3


This is quite interesting as it shows that bicycling not only helps you stay stay fit, but also it is better for your lungs !

The results are consistent with work done in 2009 by Woodrow Pattinson at the University of Canterbury in New Zealand Cyclist exposure to traffic pollution: microscale variance, the impact of route choice and comparisons to other modal choices in two New Zealand cities which concludes:


“Final comparative exposure results largely agreed with those of international studies. The cyclist (on-road) fared relatively well against other modes. Carbon monoxide exposure for the car was around 2.6 and 2.3 times higher than both the cyclist and bus, in Christchurch and Auckland, respectively. Train exposure was lower still - by a factor of 4.3, compared to car. The cyclist was also the least exposed for ultrafine particles – by a factor of 1.6, compared to car and bus concentrations which were roughly the same.

There was not a lot of variation between modes for mean PM1.0-10 exposure. PM10 was highest for the cyclist in Auckland, but only 4% greater than bus, whereas this difference was 23% in Christchurch, in favour of the cyclist. The bus mode also had the highest mean exposure for PM2.5 and PM1.0 in Auckland, while the cyclist was slightly lower than car. The bus was also highest in Christchurch, followed by the cyclist and then the car. The higher levels in the bus are likely due to diesel self-pollution and intake of outside air through open windows and the continual opening of doors.»
The level of PM10 found for Auckand (See below)  is pretty close to that measured in Toulouse:

From these studies in two different hemispheres, one can clearly state that from every point of view, mayors of smart cities are right to encourage bicycling for their citizens…..To be continued.

Documents of interest:

Urban bicycle boom in Europe

Personal exposure to air pollution for various modes of transportation in Toulouse

July 27, 2011

If you are interested in various aspects of air quality monitoring, there is a new book online edited by Nicolás A. Mazzeo.

Human beings need to breathe oxygen diluted in certain quantity of inert gas for living. In the atmosphere, there is a gas mixture of, mainly, oxygen and nitrogen, in appropriate proportions. However, the air also contains other gases, vapours and aerosols that humans incorporate when breathing and whose composition and concentration vary spatially. Some of these are physiologically inert. Air pollution has become a problem of major concern in the last few decades as it has caused negative effects on human health, nature and properties. This book presents the results of research studies carried out by international researchers in seventeen chapters which can be grouped into two main sections: a) air quality monitoring and b) air quality assessment and management, and serves as a source of material for all those involved in the field, whether as a student, scientific researcher, industrialist, consultant, or government agency with responsibility in this area.

The book can be downloaded at this website:

Online book

July 1, 2011

News from the OpenSense project in Switzerland:

27.06.11 - Rather than installing stations on fixed towers, why not use mobile sensors spread out over the whole city to get better air quality measurements? OpenSense, a project run by four laboratories at EPFL and one at ETH Zurich, is studying the possibility of installing sensors on the roofs of buses and trams, thus taking advantage of already existing public transport and mobile phone networks. Testing is currently underway in Lausanne.

Measuring air quality using mobile sensors installed on buses, trams and taxis: this is the clever idea being developed in the OpenSense project. Using the data from these sensors, a person with asthma would know what time of day the pollution was at its lowest in the neighborhood, and thus pick this moment do his or her shopping, for example. Parents would know where to take their children to play on a summer day, because they would be aware of zones with low ozone concentrations…

This project, run by four laboratories at EPFL and one at ETH Zurich, is setting up a new infrastructure for measuring air quality that takes advantage of already existing networks, such as the public transport network. Mobile, secure, predictable, and spread out over a given area, buses are an ideal data collection base. The researchers thus have set themselves the tasks of designing climate and traffic-resistant sensors that can be placed on vehicles and organizing the networking of the information they collect, using mobile phones.

“The advantage of a sensor network like this is that you can collect more data in a much more evenly spread-out area than you can from the few fixed pollution measuring stations that are currently being used,” explains EPFL Professor and project leader Karl Aberer.

As a test, a box of sensors was installed on the roof of a bus that is part of the Lausanne Public Transport system and another was installed on a tram in Zurich. These devices are collecting atmospheric data, the presence and quantity of particulates and certain pollutants - ozone (O3), carbon dioxide (CO2), nitrogen dioxide (NO2), nitric acid (NO), sulfur dioxide (SO2), and volatile organic compounds (VOCs).

Towards practical applications

A second important objective of the project is to better involve and inform the public about the quality of the air they’re breathing. In order to more precisely determine the best and most concrete use of the data collected, a complementary study is being done with the Nokia Research Center in Lausanne (NRCL). It could be, for example, a warning service or a smartphone application for people who are more susceptible to variations in pollution levels – children, people with asthma, the elderly, or people with allergies.

Although the idea of the project seems simple, putting it into practice involves overcoming numerous scientific and technical difficulties. “Being able to precisely locate the sensors is very important for the reliability of the data produced,” explains Alcherio Martinoli, one of the four EPFL professors involved in the project. This localization can be done using GPS technologies. For EPFL professor Boi Faltings, head of the Artifical Intelligence Laboratory, it’s also a matter of “getting the sensors to take data only where it’s really useful.”


News Source

Initial project presentation:
Opensense project Overview

June 29, 2011

An overview of the work of a research team in Venice for integration between satellite information and data from wireless sensor networks, wearable sensors and flying micro-devices (drones).The aim is to establish integrated systems of measurements on the state of the environment and urban contexts.
Paper presented at the International Conference on Data Flow : From Space to Earth. Venice, Italy. 21-23 March 2011

Download: NEW TECHNOLOGIES IUAV VENICE

June 25, 2011

MOS gas sensors review

In this review published in the journal “Sensors” in June 2010 by a team at University College London,  the nature of the gas response and how it is fundamentally linked to surface structure is explored. Synthetic routes to metal oxide semiconductor gas sensors are also discussed and related to their affect on surface structure. An overview of important contributions and recent advances are discussed for the use of metal oxide semiconductor sensors for the detection of a variety of gases—CO, NOx, NH3 and the particularly challenging case of CO2.